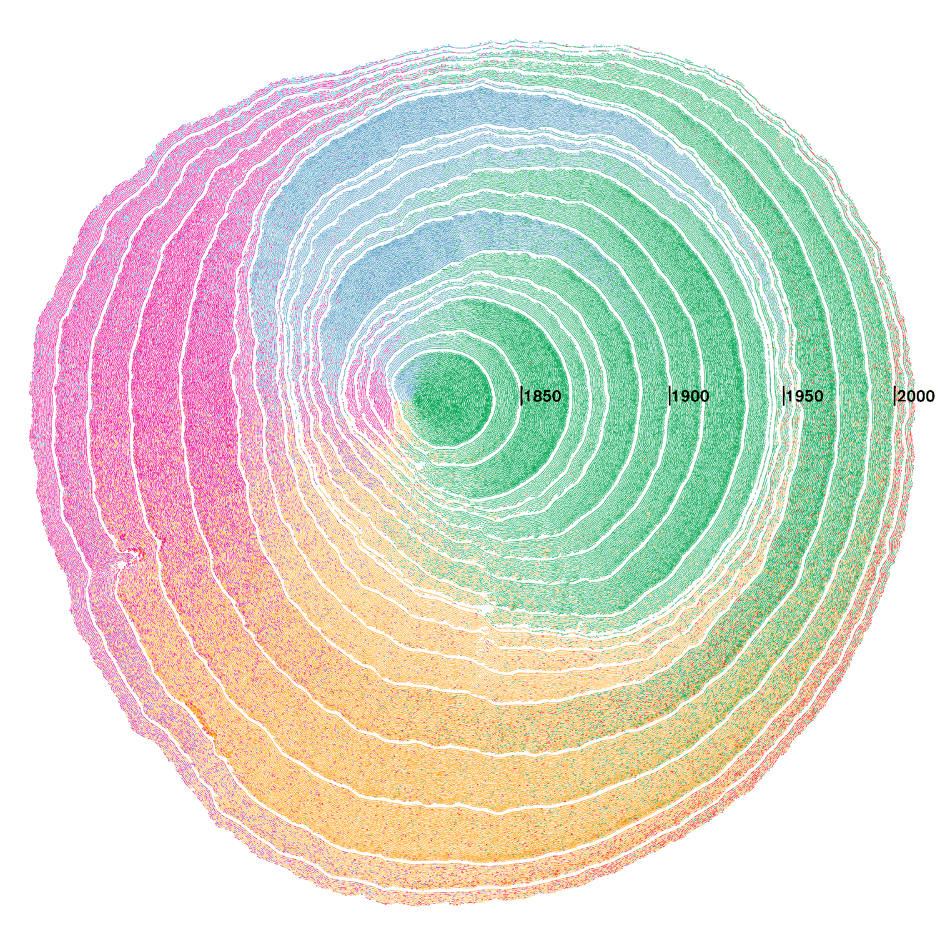

Dendrochronology may be the most interesting word you’ve never heard before: it is the scientific method of dating tree rings to the exact year in which they were made, which is how scientists determine the age of our planet’s oldest trees. What if this fascinating niche area of science could be used to visualize consecutive waves of immigration?
That’s exactly what this video does: in this model, the United States is the tree, hundreds of years old, and its cells are made out of immigrants. As immigrants arrived, the ‘cells’ they make up are shown as rings, which give a visual representation of each wave. Census questionnaires were used to collect the data for the visualization, and a computational algorithm deposited each tiny ‘cell’ in the appropriate place.
Each ring is coded in terms of colour and the direction in which it extends, in order to show the origin of that particular immigration wave. For example, European immigration is green and extends to the right of the image, and large European waves are visible between 1850 and 1950. Immigration from Latin America is coded orange, and extends to the bottom of the image. The study shows that Latin American immigration picked up in the latter half of the 20th century, between 1950 and 2000. Besides its obvious usefulness, the visualization offers a great metaphor for immigration to US, as it shows the way each wave has led to the country growing and evolving.