
If you’re craving some fast-food munchies today, you’re not alone! One of the many staples of American culture is the fast-food restaurant. It’s quick, tasty, and as you’ll see in this infographic, very profitable and competitive.
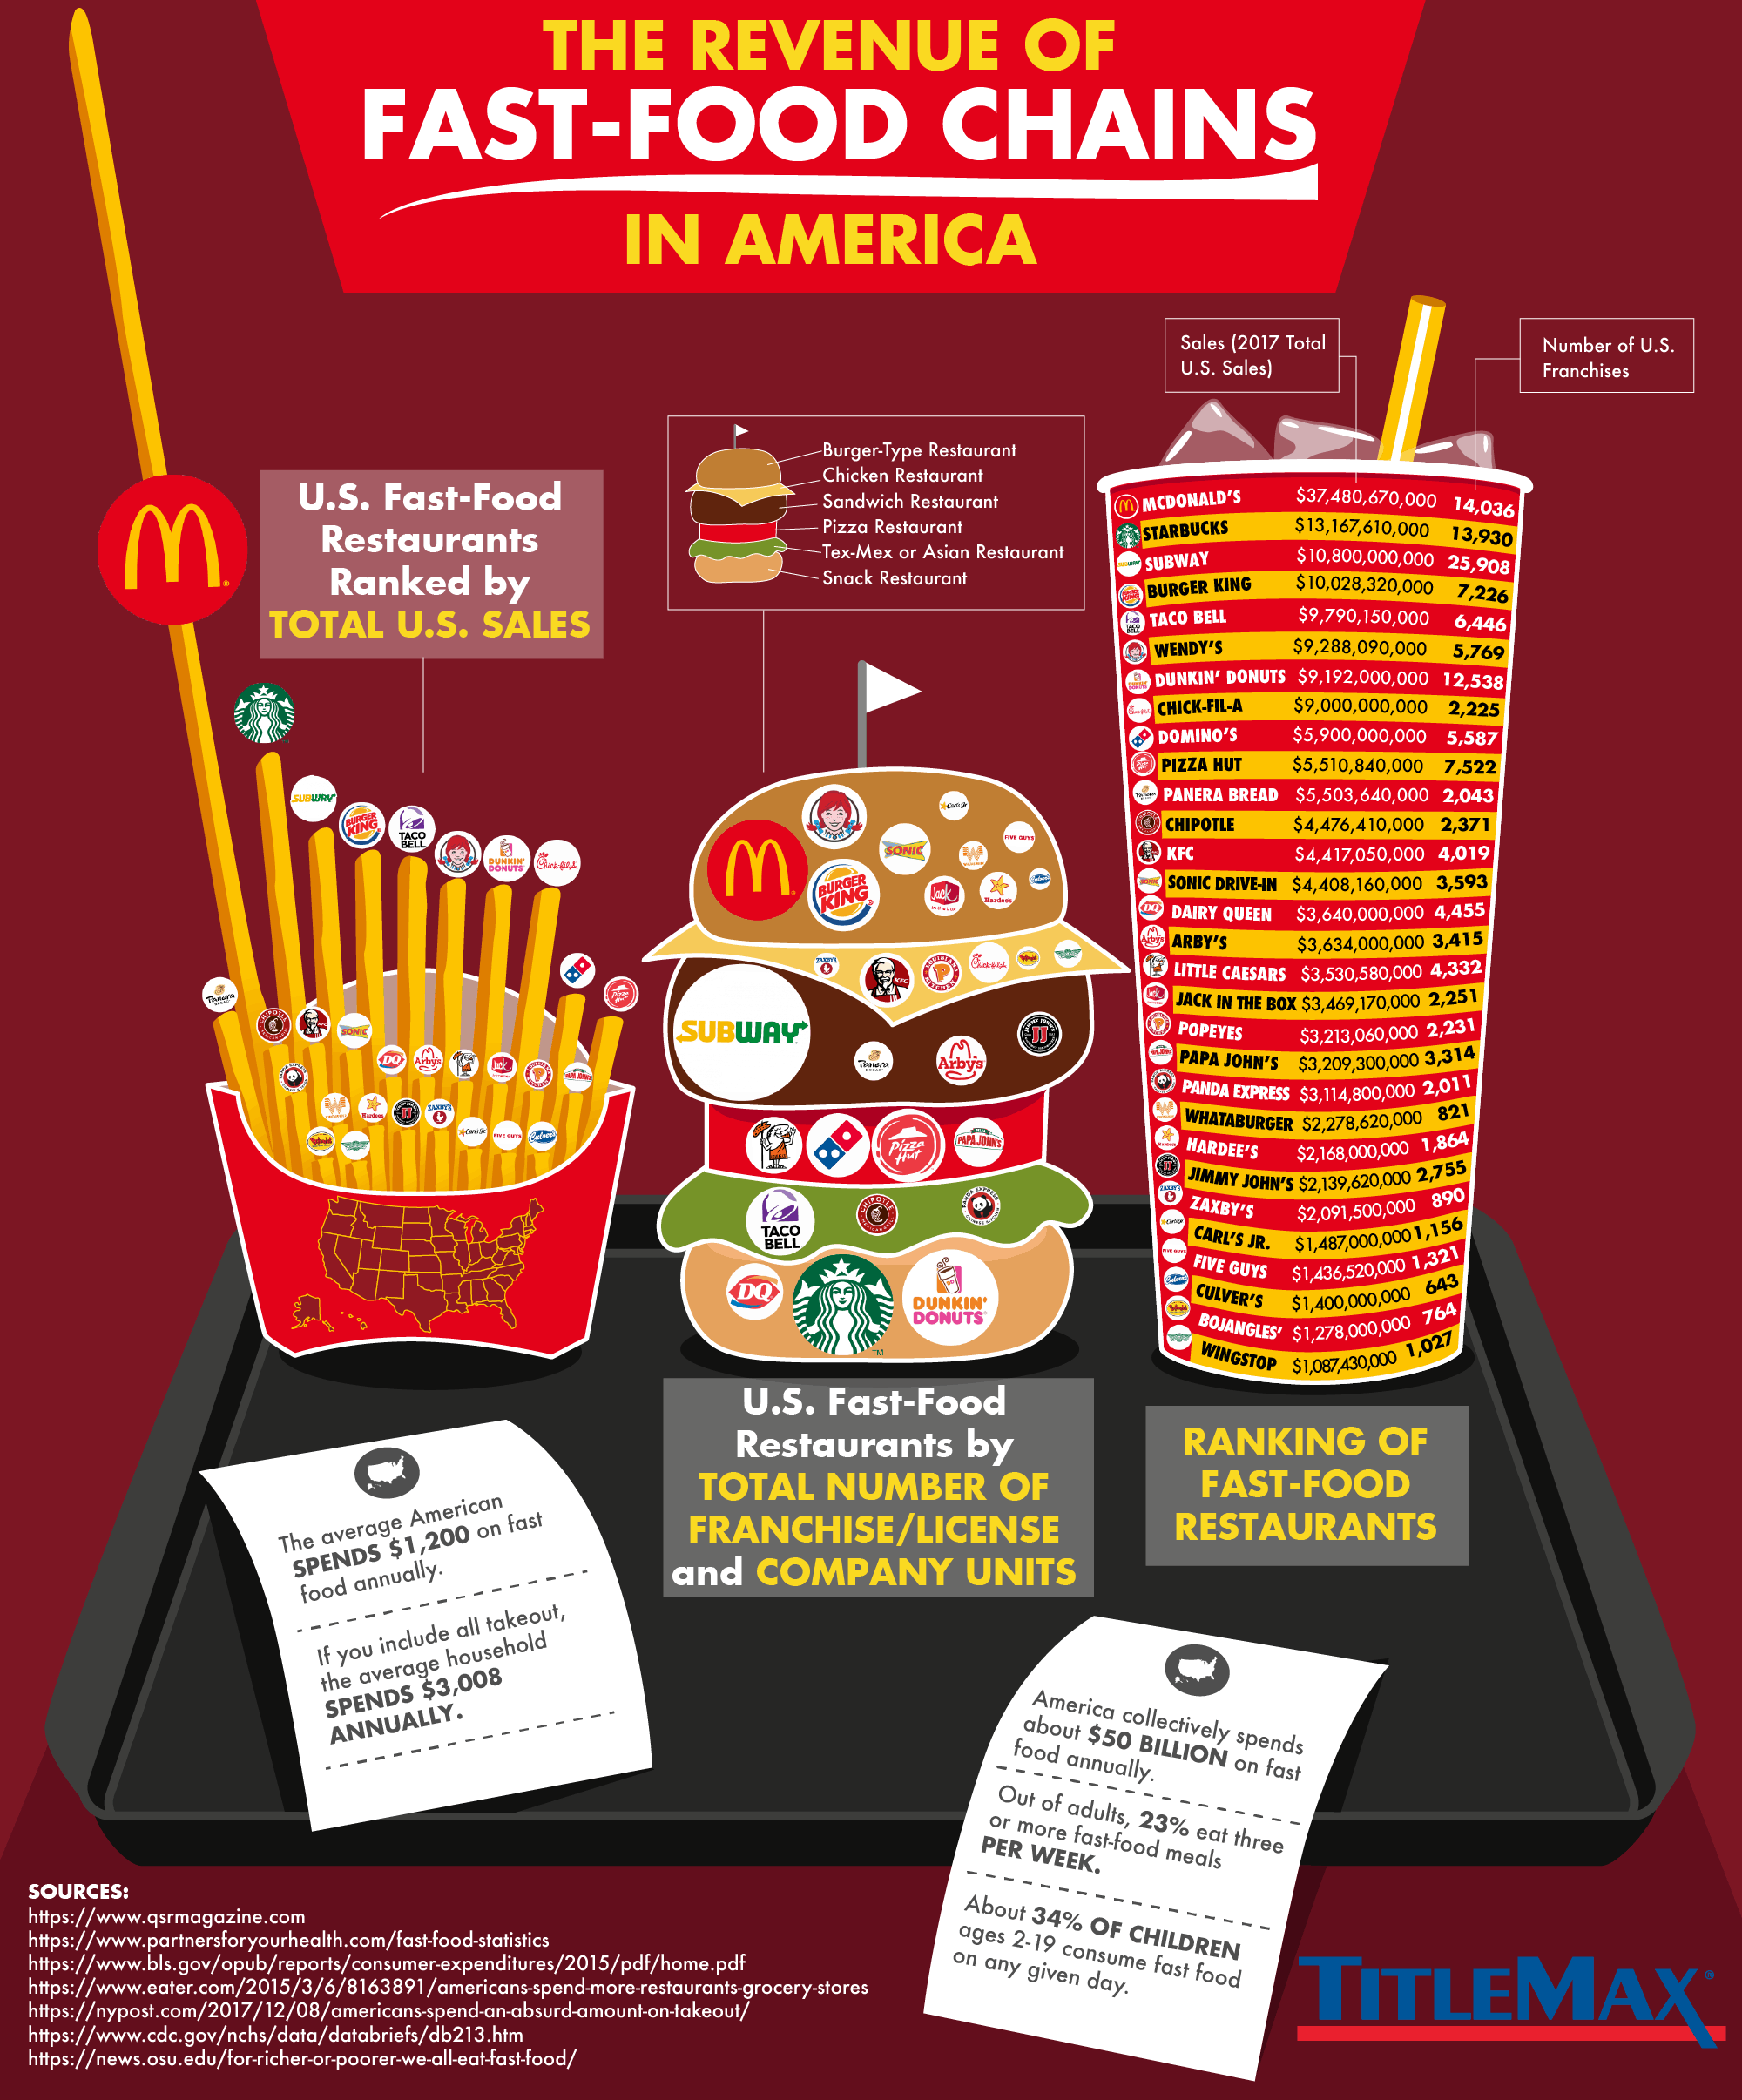
The fast-food industry in the United States is a booming one. As you can see in today’s infographic, there are 20+ fast food joints that reached over a billion in sales, and multiple chains with thousands of franchises. Some restaurants have even hit the ten billion-dollar mark. However, no other restaurant seems to even come close to approaching the total sales of the most recognizable and popular fast food restaurant (not only domestically, but worldwide), McDonald’s. McDonald’s nearly tripled the next closest competitor in terms of sales, Starbucks, by netting over 37 billion in sales in 2017, proving itself to be a true titan of the industry.
While these numbers are ridiculous, the impact on individuals should not be understated either. For instance, the average American is projected to spend $1,200 on fast food annually, and if you include all takeout, the average household spends $3,008 annually. Meanwhile, on a larger scale, we see that America as a whole spends about $50 billion on fast food annually.
On top of all of this, this infographic also provides an eye-catching breakdown of each chain divided by what type of restaurant they are. For instance, we see restaurants like McDonald’s and Wendy’s in the ‘burger-type restaurant’ category, while we see restaurants like Domino’s and Pizza Hut in the ‘pizza restaurant category’.
The fast-food industry makes a staggering amount of money, and hopefully, today’s infographic was able to put this money into perspective.