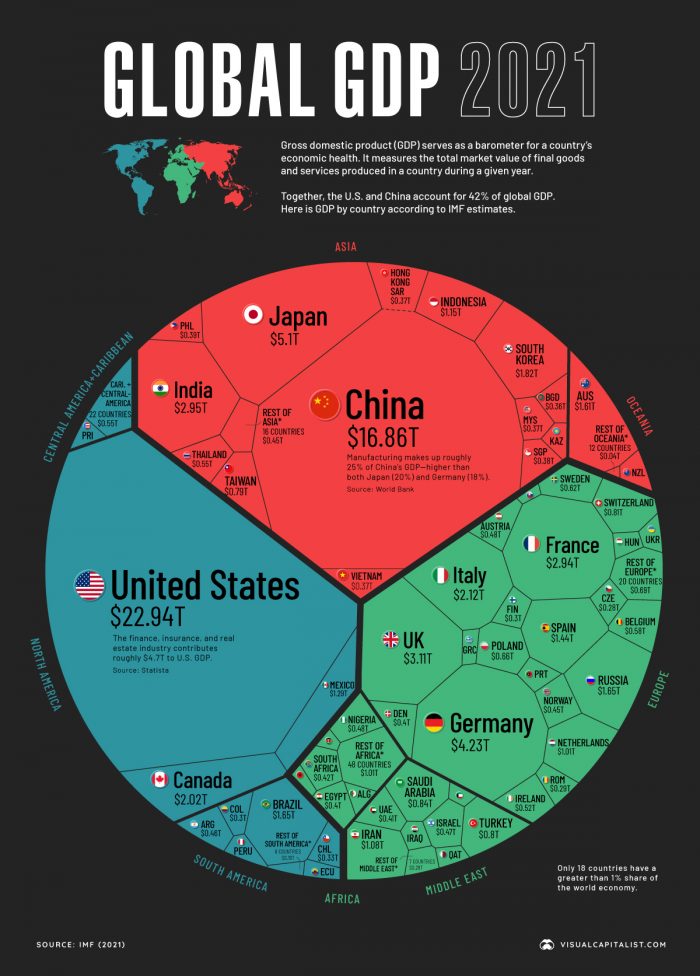
Let’s face it, the economy is a complicated topic. Most of us have trouble understanding our paycheck, much less how the economy works on a global scale. This data visualization shows the 2021 GDP of every country compared to one another.
The global GDP in 2021 was around $94 trillion. GDP stands for gross domestic product and is the best way to measure economic output in a given area. It is the total value of all goods and services produced by a country.
The world can be broken into 3 major economic powers. The United States, China and The EU (European Union). After the big 3 you have other major global players like Japan, Russia, India, South Korea, Brazil, and the Middle East due to it’s monopoly on oil production.
Is China’s Economy Bigger Than the United States?
There are a few ways to approach this question, but the answer to pretty much all of them is no. Not yet. The United States has a higher GDP with only about 25% of the population of China. If you were to break this down to per capita GDP the United States would be significantly ahead of China.
China has been growing at a faster rate than the United States for the past decade and is becoming a global leader in technology, which is a prerequisite for being a world economic power these days. Having grown GDP at close to 10% since 2000, China’s growth has began to slow in the last few years. It will be interesting to see how this battle for economic supremacy plays out over the next few decades.
The EU is Lagging Behind
One thing that stood out to me about this visualization is the size of many European economies. Some of the world powers of the last century have really began to lag behind in terms of economic growth. Germany, France, The UK, Italy, and Spain are considered more mature countries with aging demographics, but I was surprised to see that countries like Brazil and Canada are approaching them in size. While Brazil and Canada do not carry the geopolitical might of some of these European nations, it will be interesting to see if these trends continue and power begins to shift.
