Whether you work in marketing, research, education, or the non-profit sector, infographics are likely a part of your everyday life. Even if your sector hasn’t jumped on the infographic bandwagon, it is likely that you see infographics as you scroll through social media and blogs.
Despite how widespread infographics are, there is still confusion about what exactly qualifies as an infographic.
Definition of Infographic
According to Merriam Webster dictionary, an infographic is defined as:
A chart, diagram, or illustration (as in a book or magazine, or on a website) that uses graphic elements to present information in a visually striking way.
If we go by this definition of an infographic though, then virtually all types of visual information would be considered an infographic.
Even signs like the one below would be considered an infographic.
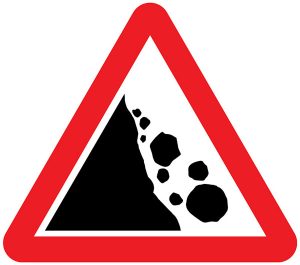
While useful, we generally now appreciate infographics to be more detailed and complex than a simple sign.
Wikipedia expands on the definition of infographic by saying that,
Infographics are graphic visual representations of information, data or knowledge intended to present complex information quickly and clearly.
The key term here is complex information. Hence why street signs aren’t considered infographics by modern standards.
I also like how Venture Beat defines infographic as a “Picture painted with data. Take a quick look and a story emerges from numbers. Look more closely, and a complex narrative emerges from dense clusters of information.”
Key Features of Infographics:
- Goal is to make large amounts of data immediately understandable.
- Information can be quickly digested.
- Visually striking.
- Engaging.
All Infographics Contain:
- Content Almost all infographics use some text to get the message across. However, there are some infographics – such as the IKEA stick figures – which convey the message without any text.
- Visuals: The visuals need to be striking and clearly convey the information.
- Knowledge: The goal of an infographic is to convey information. Without knowledge, then it is just a graphic and not infographic.

IKEA’s instructions are an example of infographics without any text.
Types of Infographics
There are a lot of design and marketing agencies that have broken down infographics into types. However, it is hard to find a consensus amongst them.
As one designer points out, the breakdown of infographic types depends on how you define the different between data, information, and knowledge. These terms are highly subjective, which explains why we still don’t have a widely-agreed upon definition of infographic, nevertheless the types.
The Harvard Business Review guide Good Charts lays out four types of infographics: declarative, conceptual, exploratory, and data-driven. In this classification system, the types overlap each other, such as declarative-exploratory.
However, I prefer the simpler breakdown of infographic types by Column Five Media. They define three main infographic types: Data visualization, information design, and editorial infographics.
As a consumer, understanding the types of infographics can help you better gauge the value of the information presented.
You’ll be able to ask yourself questions like how many data sets are being presented, and is the infographic trying to elicit a response from me? Considering that infographics have long been used as a propaganda tool, this insight can help you avoid being manipulated with data.
Data Visualization Infographics
Many of the early precursors to infographics, such as line graphs and charts, are types of data visualizations. The difference is that today’s data visualizations often present huge amounts of information.
Key Features:
- Illustrates numbers/amounts
- Delivers information
- Is objective
- Usually created for a specific niche
- Not narrative – focus on the numbers
- Tend to be more “numbers heavy” than graphic
There is a lot of debate about the difference between an infographic and data visualization. Some would argue that they are completely different things. However, the common consensus is that data visualizations are a type of infographic, but not all infographics are data visualizations.
Example of Data Visualization Infographic

Infographic shows the relative complexity of the solar magnetic field.
Information Design Infographics
With these information design infographics, the data is not specific numbers. Rather, the data is concepts which are visualized. Some examples of these information design are timelines, how-to steps, flowcharts, comparisons, hierarchical, and anatomical illustrations.
Key Features:
- Illustrates concepts rather than numbers
- Include more than one set of data or info in order to tell a larger story
- Typically aimed at a mass market
- May not be objective
Example of Information Design Infographic
The infographic shows a concept, not a specific set of data.
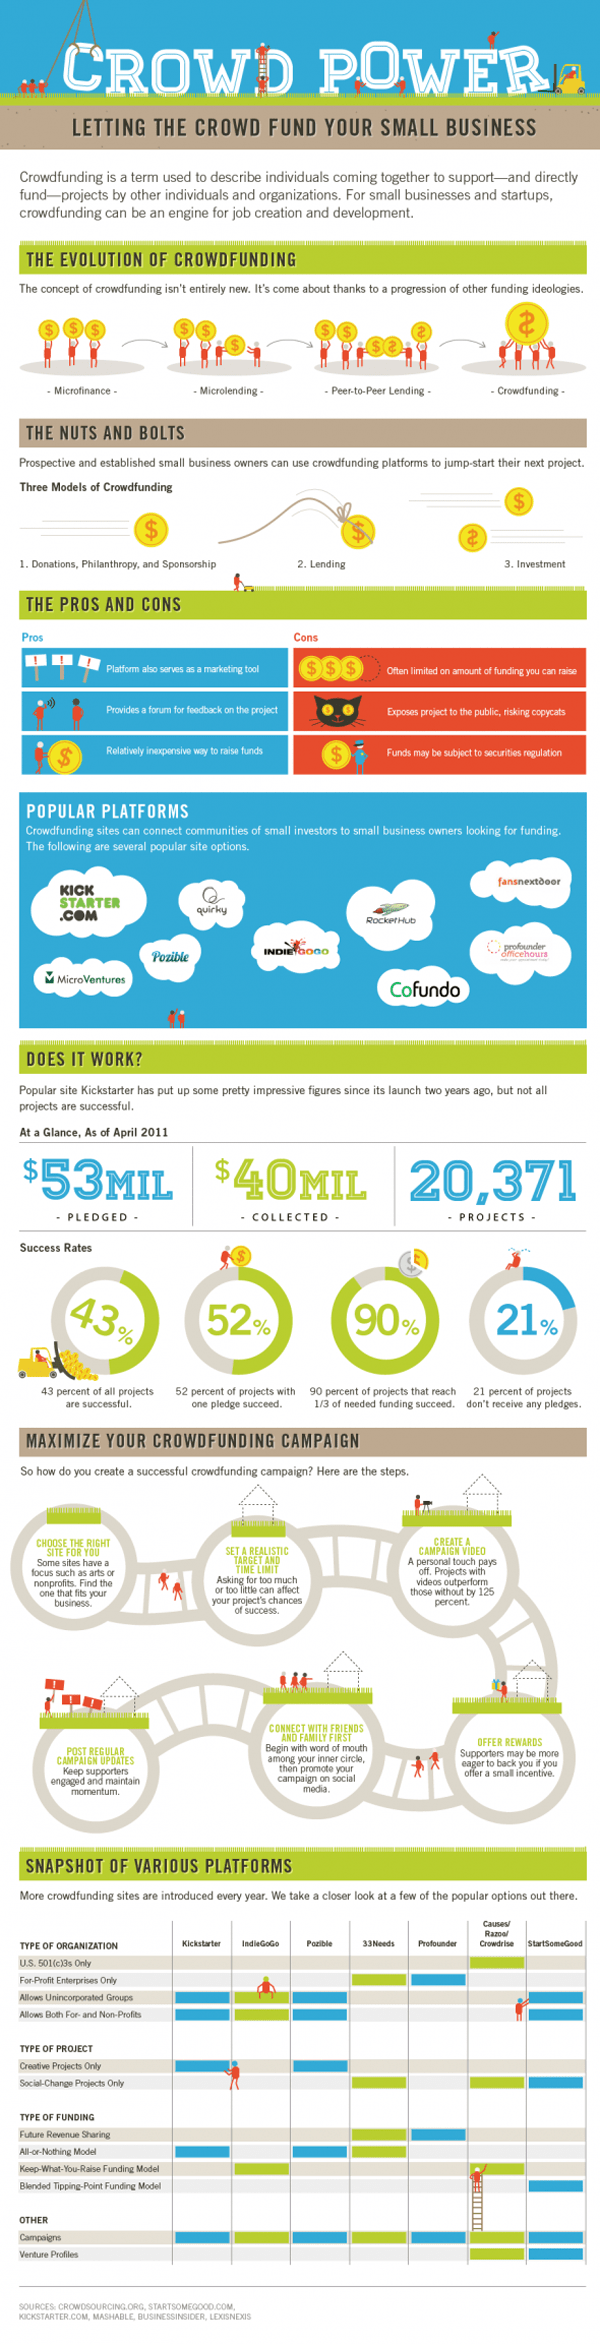
Editorial Infographics
It used to be that text-based editorials were found in newspapers and magazines to supplement the objective news reporting. Now, there is a growing trend towards editorial type infographics.
Key Features:
- Are not objective
- Have a distinct call to action
- Often used by non-profits and activist groups
- Use various data sets to support viewpoint
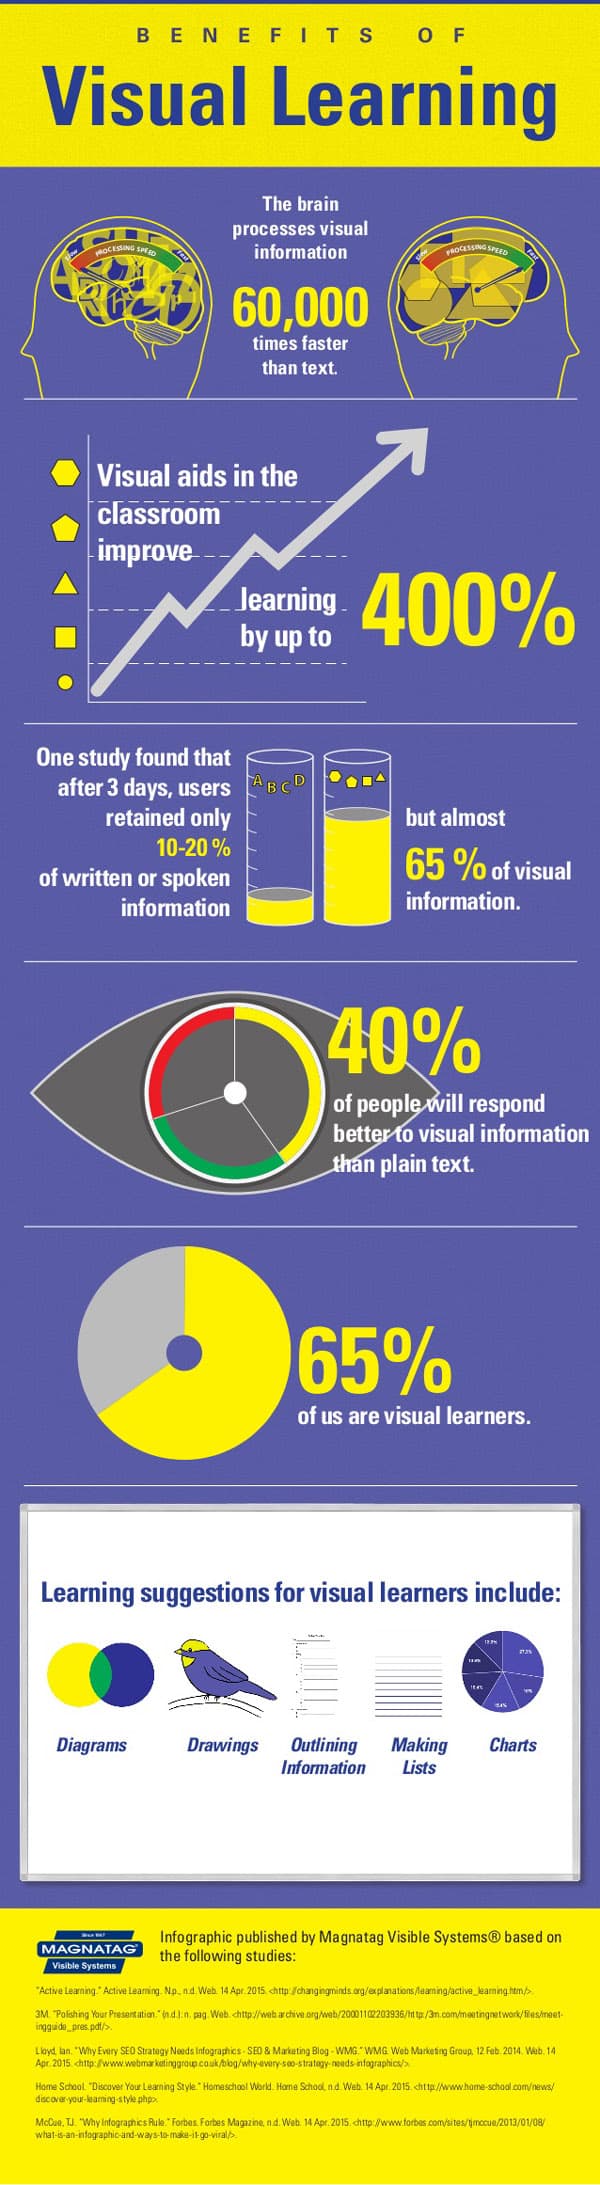
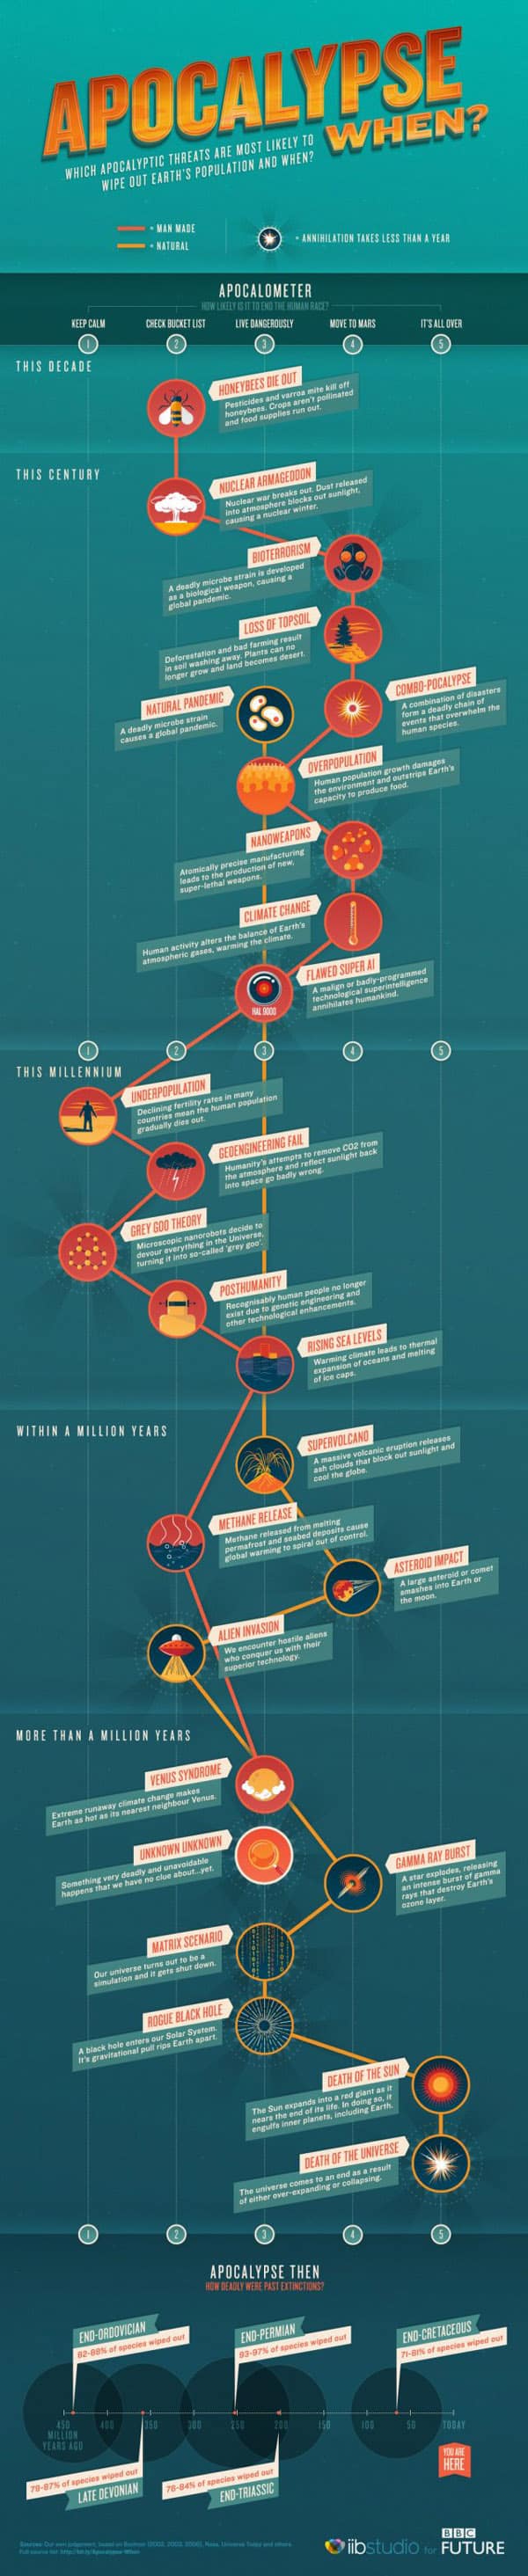
Example of an Editorial Infographic:

An editorial infographic by PeTA
Why Infographics Are So Powerful
Long before humans invented alphabet systems, they communicated with visuals. The human brain is hardwired to process visual information, and it does it much more efficiently than it processes text information.
Source
Shortening Attention Span
Another reason that infographics are so powerful in today’s era of the internet, is that they capture attention. Our attention spans have drastically shortened because of the constant stimulus we receive. In this era of goldfish brains, learning needs to be micro.
Infographics are one of the best ways to present huge amounts of data in small bites, thus making them a very powerful learning tool. They are also great for marketers who want to get their message across as quickly as possible. Color visuals increase comprehension, learning, and retention by over 73%. The appeal lasts: Eye tracking research on news pages has shown that 87% of people who saw an infographic also read the accompanying text, whereas only 41% read the text of a typical page with heading and text.
Shareability
The key to having content go viral is to make it shareable. Your readers see the content and believe that sharing it makes them look good. They then want to share it with their friends, coworkers, and grandparents. Visual content is 40X more likely to get shared on social media than other types of content (Buffer, 2014).
Infographic History Timeline
Prehistory and Early Civilization
We humans are visual thinkers, so it is no surprise that infographics have been around since even before civilization. The earliest examples of infographics are arguably cave paintings which many experts believe were used to communicate information about animals and hunting methods. There are also prehistoric examples of constellations maps and land maps. However, the combining of data and art didn’t develop until the 1600s.

Dunhuang star chart, dated to between 600 andn 900 AD.
1600s:
Maps had been around for long before the 17th century, but this is when the principles of measuring and marking distances as well as special geometry were laid down. As a result, we see a huge jump in the quality of maps during this century.
Christoph Scheiner is usually credited as the person responsible for making the first modern infographic. His map of sunspots was printed in 1626.
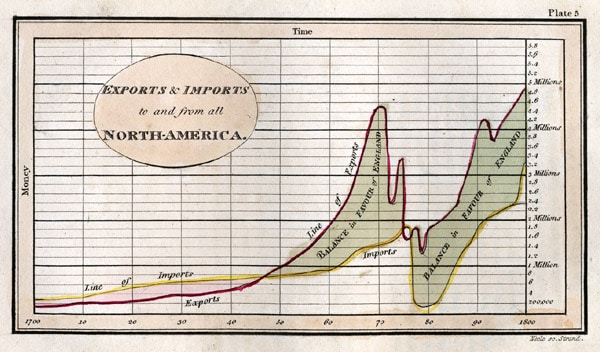
1786
The end of the 18th century in Europe was a Golden Age for sciences and arts. The date 1786 stands out as when a Scotsman named William Playfair published his work “Commercial and Political Atlas.” The work contains the first examples of a bar chart. Playfair also is credited with inventing the line, area, and pie charts.
1800s
The 1800s was the era of charts. Many government offices started using visual charts for statistical analysis. The popularity of charts led to major innovations in their types and styles.
Suddenly, we had more attractive charts as well as new types like bubble charts, contour plots, and 3d charts.
Infographic charts also started to influence history.
If it weren’t for John Snow’s 1841 cholera map (which showed cholera outbreaks linked to a common water source), he probably wouldn’t have been able to convince public officials that cholera is spread by water. Thanks to his visualization, the well pump was removed.

Cholera outbreak map
In 1860, a map of slavery influenced the course of the Civil War. By seeing which areas held slaves, the Union was able to determine which areas would fight harder to keep slavery – and which ones might switch sides.

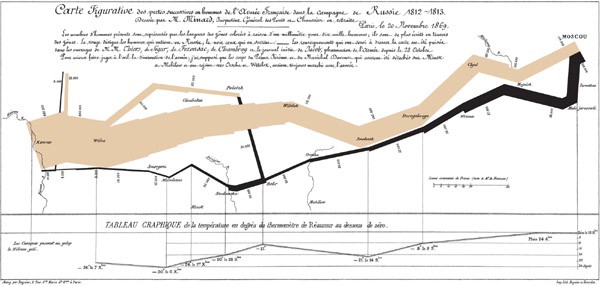
One of the first infographics to combine multiple data sets was made in 169 by designer Charles Minard. He visualized Emperor Napoleon’s 1812 invasion of Russia, showing the number of forces, distance traveled, temperatures, and rivers crossed.
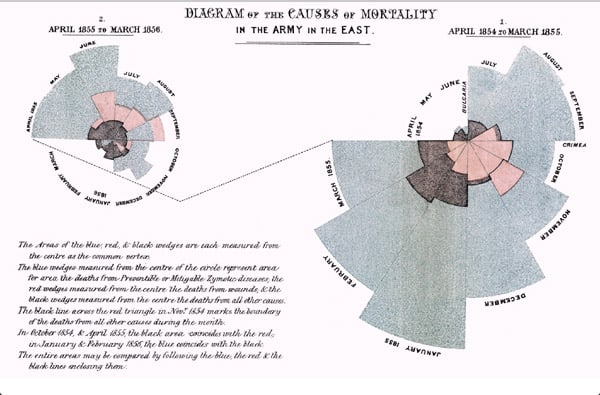
Florence Nightingale was amongst the first to use infographics for activism. Her 1858 infographic of mortality of British army was used to convince the Queen to provide better medical care for soldiers in the Crimean War.
1900s
Up until this period, infographics were mainly used to convey data within scientific circles and niche audiences. The booming 1900s found infographics being adopted by mainstream media.
People were moving to cities during this time and public transportation was getting complex. Infographics were made to help the public navigate. The first few attempts at mapping the subway systems in NYC were far from ideal. It wasn’t until 1967 that subway routes were given their own color on maps.

First NYC subway map from 1904
1990s to Early 2000s
Computers and software finally became affordable and small enough to make it into homes. Design software suddenly made it possible to visualize data quickly without having to hand-draw visualizations.
The result were infographics which were much more complex, such as network graphs, dendrograms, sunburst charts, and chord diagrams.
2000s
Now is the era we are familiar with. With the huge demand for visual content, everyone from marketers to government agencies to nonprofits have adopted infographics.
The push towards visual content also means there’s been a surge in bad infographics. It got so bad that a 2011 article in the Atlantic called the infographic trend a “plague” and “endemic in the blogosphere.”
By the end of the decade, marketers realize that they can’t make an impact simply by putting content in visual form. Consumers are demanding more to capture their attention.
The Infographic Today
Living in the information age means we are getting inundated with huge amounts of data daily. A Telegraph report found we consume the equivalent of 174 newspapers per day – which is five times more information consumed daily in 1986.
That statistic was reported in 2011. Since then, the amount of information overload has only increased.
With so much information overload, people have become very picky about what they consume. Content doesn’t even stand a chance without a visual strategy.
Thus, there is a huge push to transform content into visual form. In an article about how infographics jumped the shark, Flowing Data creator Nathan Yau comments on how infographics are replacing the blog post format.
Infographics have gotten longer to fit into the blog format. Posts that used to be long lists of favorite things and best methods have shifted to something more visual.
We’ve also seen more infographic trends like interactive, 3d, and motion infographics.
Infographics have grown to great lengths, quite literally. Keep scrolling..
Online users have also gotten immune to the visual pull of infographics. Without a good story throughout the infographic, people get bored.
Thus, it is no surprise that infographic design best practices include making a narrative flow. When done well, the narrative will engage consumers as they scroll down the infographic. The message is clear and there is a strong visual focus.
The final piece to pull it all together is a Call To Action or conclusion. Because, without a CTA guiding you in how to react, what was the point of consuming the infographic? Data only becomes knowledge when it can be put to use!